Atmospheric Site Data
The KSC Beachside Atmospheric Exposure Test Site has been characterized in terms of temperature, relative humidity, precipitation, UV, and wind speed and direction since 1995. The corrosion rate was tested yearly and seasonally in the mid-1970s with a data void until yearly testing began in 2004 led by NASA’s Corrosion Engineering Laboratory. Beginning in late 2010, monthly, yearly, and seasonal corrosion rates have been recorded along with monthly chloride deposition rates. Wave height and sulfur concentration data has also been obtained from NASA’s current collaborations with the National Oceanic and Atmospheric Administration (NOAA) and the National Atmospheric Deposition Program (NADP), both lead at KSC by the KSC Applied Meteorology Unit (AMU). In 2017, six additional test sites were created at key locations across the Kennedy Space Center to understand the corrosive conditions of each location as a function of distance from the Atlantic Ocean and time. This compilation of data has been critical for characterizing the corrosion environment in which NASA’s primary launch and ground support assets reside. This characterization is also crucial for designing an accelerated corrosion test method and its performance parameters.
This data will be updated periodically.
Corrosion Rate
The corrosion rates at the KSC Atmospheric Corrosion Test Sites are constantly measured using carbon steel panels as calibration coupons. 1010 steel (UNS 10100) panels are placed at 30-degree angles and exposed for one year in uncovered and covered configurations. The yearly exposures determine the real-time corrosion rate, as the data is normalized as corrosion rates per year per standard ASTM G1 and notated by the month in which the panels were initially exposed.
Beachside Atmospheric Corrosion Test Site
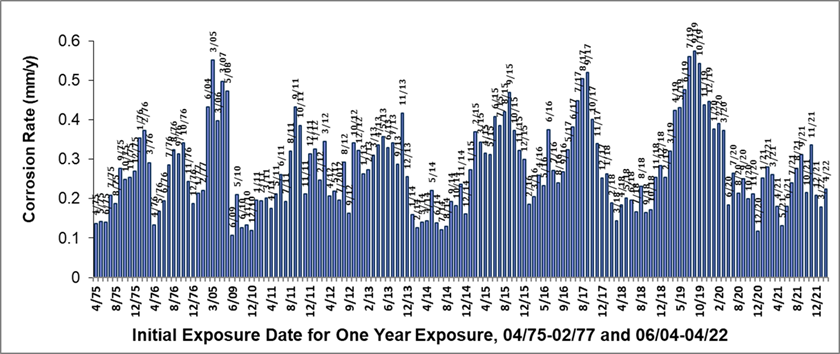
The corrosion rates of panels exposed at KSC’s Beachside Atmospheric Corrosion Test Site are variable and dependent on seasonal weather conditions. The figure below shows corrosion rate data for panels from initial exposure dates of April 1975 through February 1977 and then from November 2010 through September 2016. Panels were exposed each month for one year, and seasonal changes that influence corrosion rate are evident. The most notable influence is that panels, initially exposed from April through June, tend to have an overall lower corrosion rate when compared to those obtained during the rest of the year, with exceptions for years during which major storms occurred. Corrosion rates tend to be highest in the winter months due to the higher time of wetness that the panels experience due to temperatures being lower and allowing the morning condensation to remain on the surface for a longer period of time before it is evaporated by the higher temperatures. Winter months tend to have higher winds and wave action and therefore more salts tend to collect on the sample in those months as well. Winter is also a dryer season, so less salts are rinsed off by rain that in the summer months. Seasonal variations change from one year to the next because, for example, rain patterns can be similar or can vary from one year to the next. An average corrosion rate for 1010 steel panels at the Beachside Atmospheric Corrosion Test Site is thus difficult to define by one value without considering other seasonal characteristics of the exposure site. The corrosion rates measured at the site vary from 0.127 mm/y to 0.51 mm/y (5.0 to 20.0 mpy), with a weighted average of 0.28 mm/y (11.0 mpy). This data will be updated periodically.
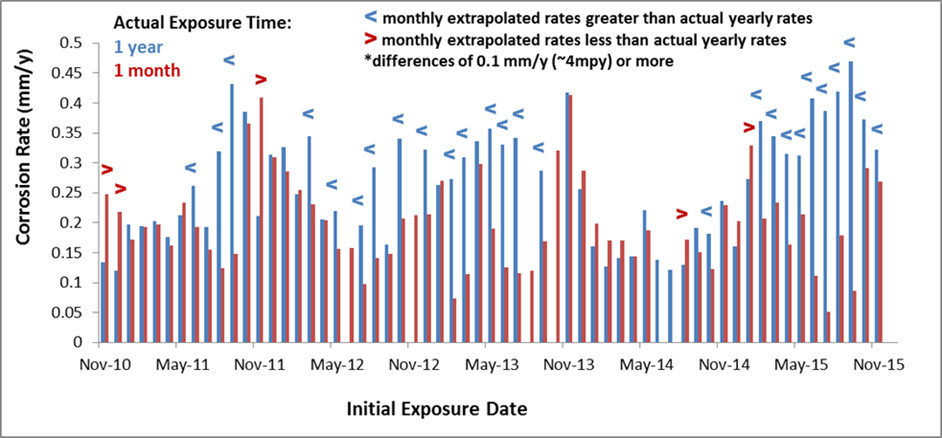
Originally monthly exposures were also included at the beachside test site to help determine the seasonal corrosion rates and extrapolated yearly corrosion rate. Ultimately the extrapolated values were shown to not be a good predictor of the yearly corrosion rate values. The data is shown in order to provide practical value to those who may be considering corrosion rate extrapolation and may not understand the downfalls of doing so. When considering whether or not the extrapolated corrosion rates were reflective of the year-long corrosion rate values, the extrapolated data was compared to the actual year-long data. A significant difference between the extrapolated and real-time data was defined as when the corrosion rates had a delta of 0.10 mm/y or 4mpy or higher. The figure below shows that, for the measurement period between November 2010 and November 2015, the data was statistically similar for only about fifty percent of the time. Of the cases when there was a statistically significant difference the monthly extrapolated corrosion rate value was greater than the yearly value roughly forty-three percent of the time; however, this cannot be considered a general rule. In eight percent of the cases, where the monthly extrapolated corrosion rate value was lower than the yearly value, the yearly rate was nearly double the corrosion rate of the monthly data. Thus, as a general rule for the KSC exposure site, samples exposed for only a one month period cannot be extrapolated into yearly data because the exposure period is too short in length to successfully compare to real-time yearly corrosion rate values. Monthly corrosion rates are no longer being collected because the data was not deemed valuable for determining yearly corrosion rates of the site.
Corrosion rates for the six other atmospheric test sites is not available at this time because the panel exposures began in June 2016, therefore no yearly corrosion rate data has been generated. The website will be updated with this data as it becomes available in the future.
Chloride Concentration
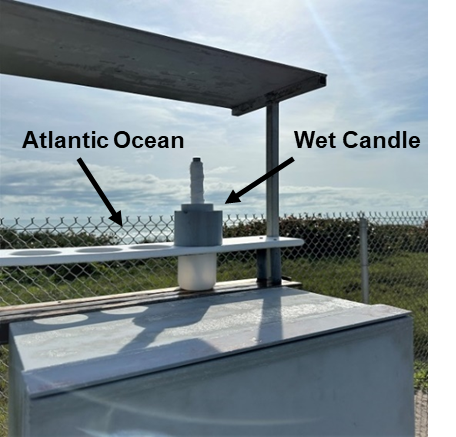
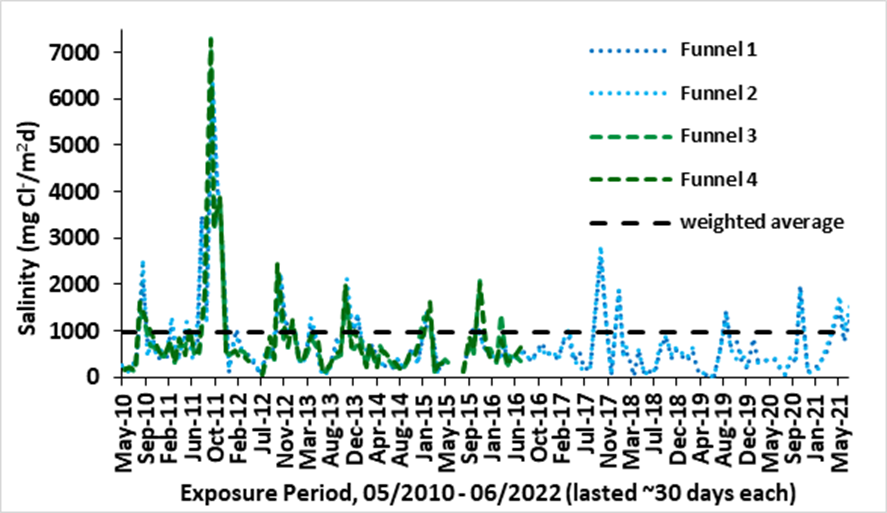
Chloride deposition at all of the atmospheric test sites is monitored continuously using the wet candle method, ISO-9225 (latest revision), “Corrosion of Metals and Alloys – Corrosivity of Atmospheres – Measurement of Pollution”, (Geneve, Switzerland ISO). Each set is exposed for a one-month period before replacement. Chloride concentration is measured using a chloride ion probe using the EPA Method 9212. Figure 2 shows an example of the wet candles alongside the beachside panel exposure racks.
The chloride concentration was measured during an exposure period from May 19, 2010 through March 27, 2015. Overall, the chloride deposition at the KSC beachside site is high when rated using criteria from the ISO 9223 standard ISO-9223 (latest revision), “Corrosion of Metal and Alloys, Corrosivity of Atmospheres – Classification”, (Geneve, Switzerland ISO), where the highest level of chloride deposition is related to a deposition rate of between 300 and 1500mg/m2d. The chloride deposition rate at KSC’s Beachside Atmospheric Corrosion Test Site varies between 70 and 7300 mg/m2d, with a weighted mean value of 983 mg/m2d.
Atmospheric Conditions
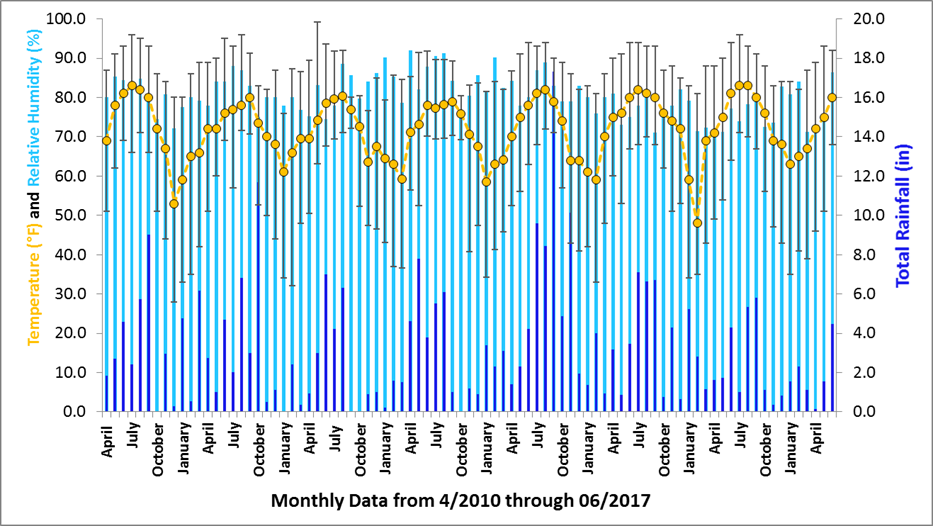
Weather parameters, such as temperature, relative humidity, UV, wind speed and direction, and total precipitation values, are recorded at the beachside atmospheric test site continuously. The precipitation values are measured as a total amount collected every twenty minutes, and the temperature and relative humidity are measured every twenty minutes. The average monthly temperature, relative humidity, and precipitation values from April 2010 through March 2017 are shown in Figure 1.
Sulfur dioxide concentration was measured through the NADP monitoring location FL99, which is located at the Kennedy Space Center and operated by NASA. The sulfur dioxide deposition data, in kg s/ha-yr, is taken from the NADP database website, Environmental Protection Agency, http://java.epa.gov/castnet/viewsiteinfo.do?siteId=IRL141, and translated into mg/m2-day values. Sulfur dioxide concentration was found to be very low within the Kennedy Space Center, with yearly totals ranging from 0.92 to 1.81mg/m2-d from 2002 to 2010. A value of less than 4 mg/m2d is ranked as the lowest level in the ISO 9223 standard for pollution by sulfur-containing substances represented by sulfur dioxide.
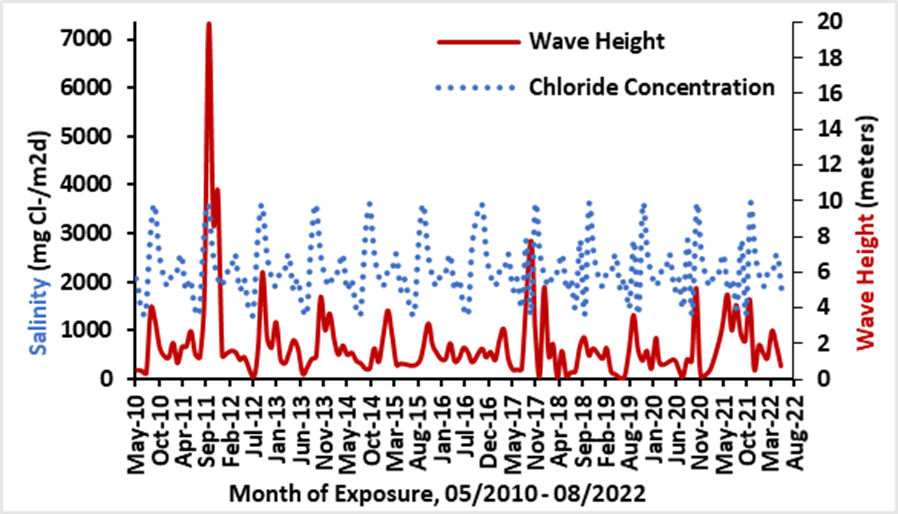
Wave height measurements were collected from a weather buoy, buoy #41009, off the coast of Cape Canaveral that is funded by NASA and operated by the NOAA National Data Buoy Center. The average monthly wave height data over a period of ten years was extracted from the database website, National Oceanic and Atmospheric Administration, http://www.ndbc.noaa.gov/view_climplot.php?station=41009&meas=wh.
The wave height was monitored because of the relationship between wave height and concentration of marine aerosols, where increased wave height is generally related to an increase in chlorides in the air. Bubbles created from increased wave action are the main generator of marine aerosols and are generally directly related to wave height. The monthly average wave height for ocean water off the coast of Cape Canaveral and approximately twenty-five miles from the wet candle location was compared to the monthly average chloride concentration values to verify the general relationship. The comparison shows that higher wave heights directly relate to increase chloride concentration values, assuming no major weather events.